


 •
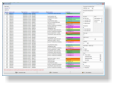
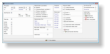
Process statistic showing the process way for the article, all times,
voltages, currents, temperatures etc., in all bath for an article. Both
setpoints and actual values in the stations are shown. Any deviations are
indicated by colors and more. The statistics also show the current time in
station, time since entry in system, alarm limits, special events and more.
•
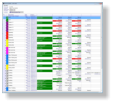
Report generator to find events in the pipeline. Times, temperatures, etc.
•
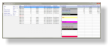
Key figures for production statistics. Availability and utilization.
•
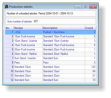
Production statistics for number of produced items, number of overtaking,
number of wrong process, loading and unloading times, different stop
times in the plant etc..
Home
Prev.
Next
End
•
Process statistic showing the process way for the article, all times,
voltages, currents, temperatures etc., in all bath for an article. Both
setpoints and actual values in the stations are shown. Any deviations are
indicated by colors and more. The statistics also show the current time in
station, time since entry in system, alarm limits, special events and more.
•
Report generator to find events in the pipeline. Times, temperatures, etc.
•
Key figures for production statistics. Availability and utilization.
•
Production statistics for number of produced items, number of overtaking,
number of wrong process, loading and unloading times, different stop
times in the plant etc..
Home
Prev.
Next
End


 © Turntech AB


 © Turntech AB


